2.2. Multivariate Analysis Concepts#
Let’s begin by thinking about spuriousness. We can explain what is meant by a “spurious association” with examples.
A famous example is the firefighters example: For all fires in London last year, data are available on \(x\) = number of firefighters at the fire and \(y\) = cost of damages due to the fire. The correlation between \(x\) and \(y\) is positive.
Does this mean that having more firefighters at a fire causes the damage to be worse? Can you identify a third variable that could be a common cause of \(x\) and \(y\)?
Click to reveal answer
No! Without as many firefighters, the damage could potentially be even worse. Even though there is an association between the two variables, here there could likely be an alternative explanation, namely, a variable \(z\) that causes both \(x\) and \(y\).
In this case, this variable \(z\) could be the “size of the fire”, which leads to both an increase in the number of fire fighters called to the scene and an increase in the cost of the damages due to the fire. Larger fires tend to have more firefighters at the fire and have more costly damage.
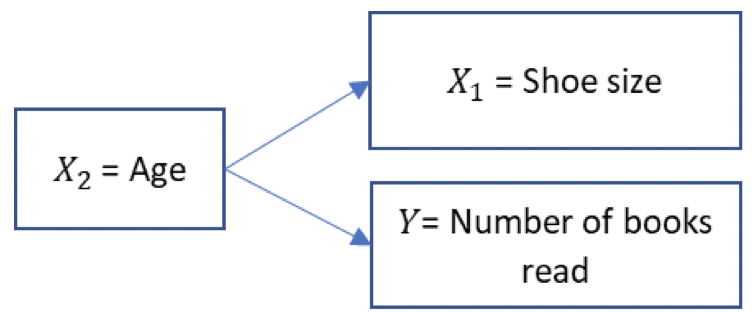
Another example is shoe size and literacy among children. This is another spurious association, that can be explained by age. As children get older, their feet grow and their reading skills improve. We can illustrate a spurious relationship graphically, with variable labels and arrows, like below.

The reason that it is important to think about spuriousness and different types of multivariate analysis is because scientific endeavour is interested in establishing causal relationships. It is not enough to cite an association between two variables; scientists try to understand how the world works in their research, which means furthering our understanding of causal processes. In real-world research it can be difficult to prove causality, especially with observational data (more on this in Trinity Term).
Recall from the lecture, what are the three criteria for establishing causality?
Click to reveal answer
Association between the variables. Here we must show that x and y are associated, i.e., if x causes y, then as x changes, the distribution of y should change in some way. For sample data, a statistical test, such as chi-squared or a t-test can tell us whether this criterion is satisfied. Association by itself, however, cannot establish causality.
An appropriate time order. The second criterion for causality is that the two variables have the appropriate time order, with the cause preceding the effect. Sometimes this is just a matter of logic. For instance, race, age, and gender exist prior to current attitudes or achievements, so any causal association must treat them as causes rather than effects. In other cases, the causal direction is not as obvious. Consider mental health and unemployment, for example. How can we explain the higher levels of depression among people who are unemployed? It is reasonable to assume that the predicament of being unemployed, and missing the social and economic benefits of employment, might cause depression. However, it is also feasible that people who are experiencing depression are more likely to struggle at work, and to become unemployed.
The elimination of alternative explanations: When two variables are associated and have the proper time order to satisfy a casual relation, this is still insufficient to imply causality. We need to be sure that the relationship is not spurious. The association may have an alternative explanation.
An important concept in multivariate research is the control variable. This concept relates to point 3) in the causal criteria. A control variable can be used in analysis to help us to rule out alternative explanations. Thinking about our examples of spurious relationships, if we really wanted to study the relationship between number of firefighters and fire damage, we would need to control for size of the fire. If we wanted to examine the link between shoe size and reading, we would obviously need to control for age. In this last example, I would expect the association between shoe size and reading skills to disappear completely once we control for age.
These examples are not very subtle!
Often, as scientists in the social, human, and medical sphere, we need to deal with complex and overlapping concepts, making it potentially more difficult to make causal links. To illustrate, let’s take the link between income and health as an example, where people with higher incomes have better health due to access to better resources. An alternative theory might propose that people with higher incomes tend to have higher education, and people with higher education tend to have healthier lifestyles. So, is it about resources or education? To be sure we would want to examine the association between income and health, after controlling for education (and possibly after controlling for health behaviours too, e.g., smoking). In short, to really understand relationships between variables to explain real-world research questions, we need multivariate analysis.
