2.6. Multivariate analysis and interaction terms#
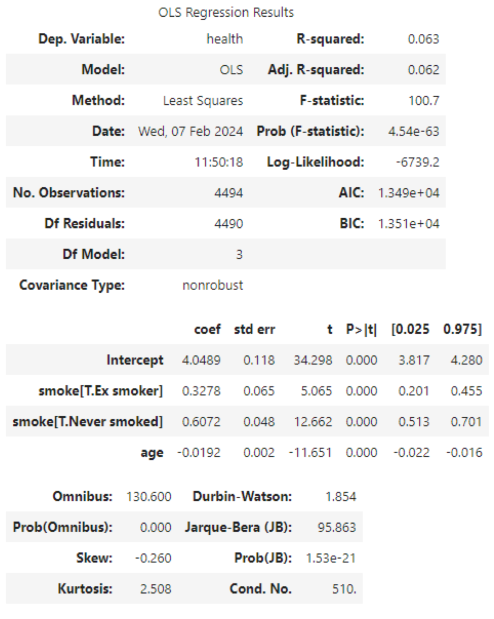
Let’s continue working with the same example here – smoking and health. This time, we will add age as an additional x variable. It will come as no surprise to know that there is a strong statistical relationship between age and health, as health declines in older ages. The output from Python, with age added to the model, is:
What is the relationship between age and health?
Click to reveal answer
As expected, older age is associated with worse health. The coefficient of -0.0192 can be interpreted as every additional year of age being associated with lower health by 0.0192 points.
Is this a large effect or a small one?
Click to reveal answer
It is always tempting to interpret small numbers as small effects but remember that you must think about the scale of the x variable (and the y) to understand if this effect is large or small. Imagine we have a 20-year-old and a 65-year-old, a gap of 45 years. If we take the slope of \(-0.0192 \times 45\) it gives 0.864 and suggests that the hypothetical 60-year-old has a health 0.9 (rounded up) points lower than the 20-year-old. Perhaps then, this effect is not so very “small”, given that the scale only ranges from 1-5. Indeed, this age difference we just calculated is larger than the difference between current smokers and people who have never smoked. In short, be careful in deciding that an effect is “big” or “small”.
The N in this model (including age) is 4494, but the N in our first model (on the previous page) was 4527. Do you have any idea why this might be?
Click to reveal answer
It is likely that the N changed because of missing data in the variable we just added. Here, the difference between the two Ns suggests that 33 cases had missing data for age. This is one of the reasons that it is a good idea to check all your variables before running a regression – know your data; know how many NaNs you have!
Why have the parameter estimates for smoking changed in this new model?
Click to reveal answer
We have added age to the model which is an important explanatory variable for health. We can now interpret the smoking coefficients as being the effect of smoking once we have controlled for age. But note that, sometimes, if there are changes in the sample sizes between models, parameter estimates might also shift a little because the model is now estimated on a different set of cases.
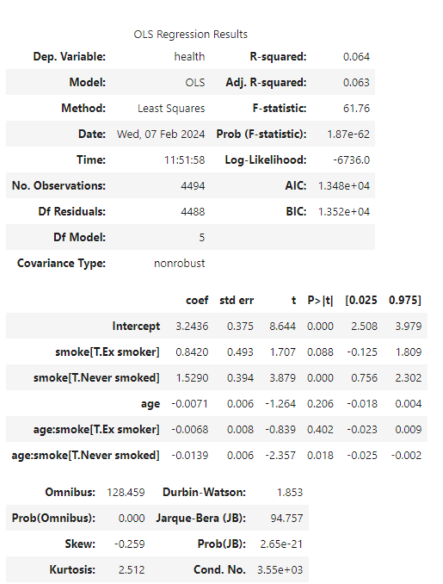
As our final model in the smoking example, let’s take a look at the interaction term between age and smoking. Remember that an interaction term helps us to understand if the effect of a variable x1 is the same for all values of a second variable, x2. Here is the model output table from Python after specifying the new model with the interaction term:
How do interactions appear in the model?
Click to reveal answer
With a colon, e.g., “age:smoke”
How can we interpret the “main effect” of age in this model?
Click to reveal answer
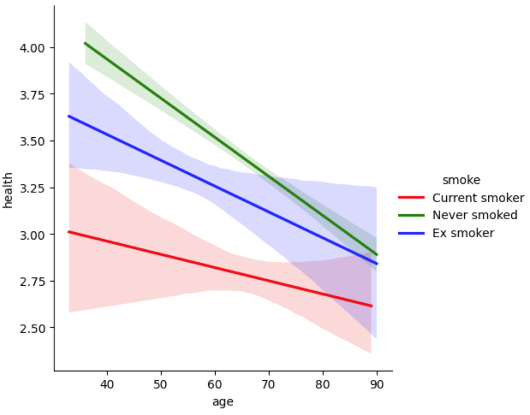
The term “main effect” refers to the coefficient for age that is NOT part of the interaction term. The main effect of age in this model is -0.0071. This is substantially reduced compared to our model above. We can interpret the main effect as being the effect of age for the reference category of smokers, which were the current smokers. In other words, age declines by 0.0071 points for each year of age among people who are currently smokers. For people who have never smoked their age slope is the main effect + the interaction term [-0.0071-0.0139= -0.021]. But we need to be careful here because the main effects of the two dummy variables for smoking have also changed! Interaction effects are difficult to interpret, even for well-seasoned researchers, and a plot can often help – see below.
The plot shows us that the downward slope is steeper for the people who have never smoked. And shallowest for the current smokers. Another way to think about this is that the health gaps by smoker status are larger when people are younger, and much narrower when people are older. You will practise running plots like this, and interpreting interactions, in this week’s tutorial.