4.3. Concepts Review#
Here we review some conceptual points from the lecture.
Please try to answer each question yourself before clicking to reveal the answer
You can discuss these points with your tutor at the computer-based tutorial session (these sessions are for discussing concepts as well as for developing Python skills)
- A researcher measures weight (in stone) and height (in inches) for men. She calculates the correlation and covariance. She then decides to convert her data to metric units, kilograms and centimetres. One kilogram is 0.157 stone and one centimetre is 0.39 inches. What will happen to the correlation and covariance?
Click to reveal answer
correlation won’t change is it is normalized by s.d. in x and y and therefore unaffected by units
covariance will increase as the spread in weight and height are both greater for metric units (ie range of weights in kg is greater than range of weights in stone; range of heights in cm is greater than range of heights in inches)
- What are the assumptions of Pearson's r?
Click to reveal answer
- no outliers
- straight line relationship
- homoscedasticity

- Which features of each illustration above violate the assumptions
of Pearson's r?
Click to reveal answer
- outliers
- heteroscedasticity
- straight line relationship
- What is heteroscedasticity?
Click to reveal answer
The ice cream cone effect!
Heteroscedasticity is when the variance in y differs for different values of x (or vice versa).
- Explain why heteroscedasticity is common in real datasets
Click to reveal answer
Often the variability in data is proportional to their mean value.
For example consider a dataset of weight (y) against age (x) from birth to adulthood.
The difference between a light and heavy two year old is only a few kg (as a two year old weighs less than 20kg), but the difference between a light and heavy adult is much greater as the average weight of an adult is greater.
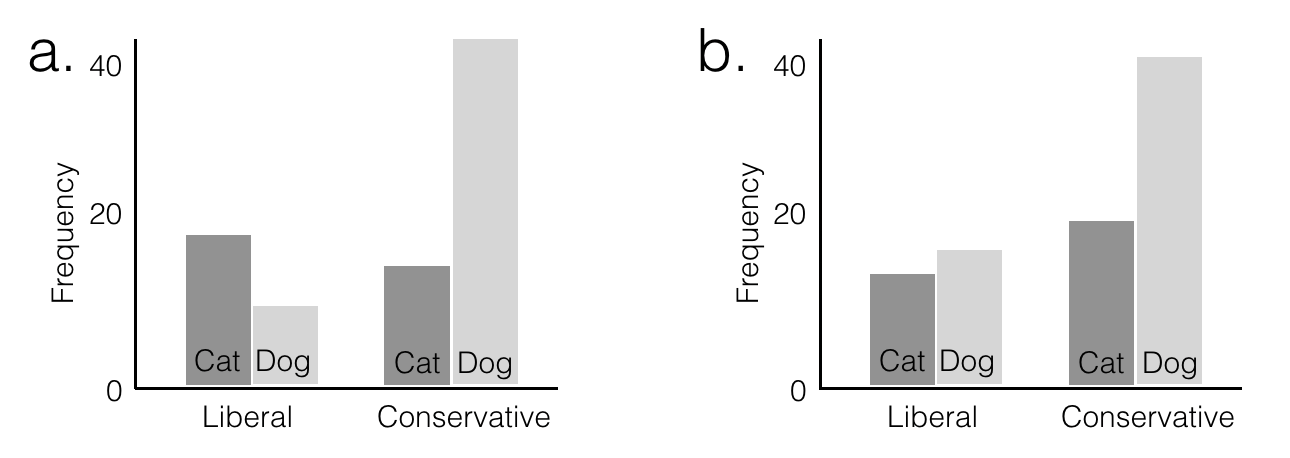
- The two plots above show type of pet owned by two (fictional) samples
of men. For each man the researcher recorded whether he descriebs
himseld as politically liberal or conservative, and whether he prefers
cats or dogs
Explain what is meant by an interaction between categorical variables and why each of the plots above illustrate such an interaction
Click to reveal answer
An interaction is when the proportion of cases of one variable (cat v dog) differs depnding on the value of another variable (liberal v conservative).
In example a, we have a crossover interaction, whereby more liberals are cat owners (than dog owners), but the reverse is true for conservatives.
In example b, we also have an interaction - in this case dogs are more popular than cats in both political groups, but the proportion preferring dogs is much greater in the conservative group, whilst cats and dogs are more equally balanced in the liberal group.
