
16.3. ANOVA Concepts#
Analysis of Variance (ANOVA) is a test of independence where the outcome variable is continuous, and the explanatory variable is categorical. It is a way of comparing means across groups and is preferred where there are more than two groups. If we ran an experiment with three groups – say treatment1, treatment2, and control group - ANOVA enables the researcher to test the means of these three groups simultaneously.
If there were only two groups, which test would you use to compare means?
Click to reveal answer
The $t$-test. We use ANOVA when there are more than two groups.
Why is a comparison of means called Analysis of Variance?
Click to reveal answer
ANOVA uses the variance to compare means.
It compares the variability between the overall mean $\bar{y}$ and the group means $\bar{y_i}$ (where subscript i means ‘in each group’) with the variability within each group $\bar{y_1}, \bar{y_2}, \bar{y_3}$ etc. (where subscript 1 means ‘in group 1’ and so on).
Look at the example dataset below, from Agresti and Finlay (Figure 12.1)
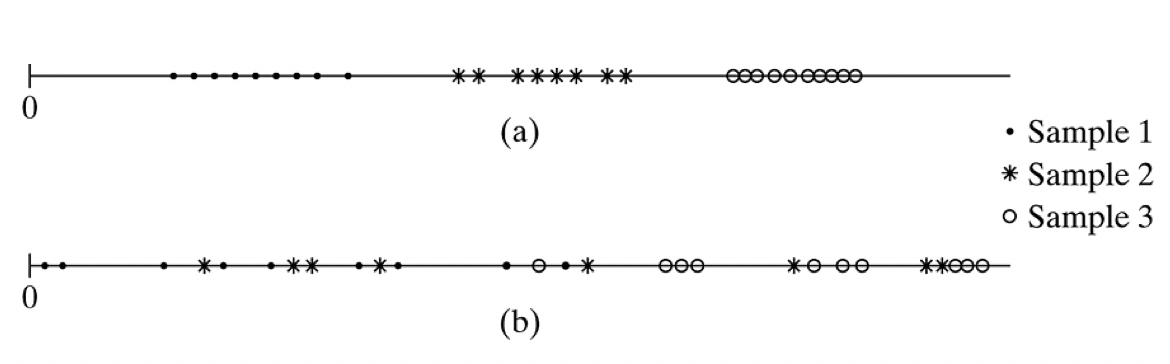
The means of the three groups in a are clearly different to each other.
In b there is more overlap between the data points, and it is harder to tell just by eyeballing the data whether there is a difference in means in the three groups.
In this example, the means of the three groups, and the overall mean, are the same in a and b which means that the variability between groups is the same in a and b. However, the variability within groups is lower in a than in b. Low variability within groups suggests that the groups have means that are statistically different to each other.
ANOVA uses the $F$-statistic to test whether there are significant differences in means across groups. The $F$-statistic is a ratio of the between-groups variance divided by the within-group variance as follows:
$$ F = \frac{\textrm{Between-groups estimate of variance } σ^2}{\textrm{Within-groups estimate of variance } σ^2} $$
What does it mean when the $F$-statistic is large?
Click to reveal answer
The $F$ test statistic is large if variability between groups is large relative to variability within groups.
Looking back to the example above, where the within-group variability is lower in a than in b, we would expect a larger $F$ value in a than in b. Larger $F$ values have smaller $p$-values and indicate that there is a difference between groups. The cut-off value for $F$ (i.e., what counts as ‘large’) depends on the degrees of freedom (sample size and number of groups). When you run ANOVA in a stats package such as Python, it will produce the $p$-value for you.
What are the assumptions of ANOVA?
Click to reveal answer
The three assumptions are:
For each group, the population distribution of the response variable $y$ is normal.
The standard deviation of the population distribution is the same for each group. Denote the common value by $\sigma$
The samples from the populations are independent random samples.
What is the non-parametric equivalent of ANOVA?
Click to reveal answer
The Kruskal-Wallis test.
The Kruskal-Wallis test ranks the observations and compares mean ranks of the groups, thus uses only ordinal information in the data.