2.4. Mean and Median#
The mean and median are sometimes called measures of the location or centre of a distribution.
They both tell you something about the typical or average value in your dataset - but different things.
Set up Python libraries#
As usual, run the code cell below to import the relevant Python libraries
# Set-up Python libraries - you need to run this but you don't need to change it
import numpy as np
import matplotlib.pyplot as plt
import scipy.stats as stats
import pandas
import seaborn as sns
sns.set_theme()
The Mean#
The mean is obtained by adding up all the data values ($x_1, x_2….. x_n$) and dividing by the number of datapoints $n$:
$$ \bar{x} = \frac{\sum{x_i}}{n} $$
Toy example: mean#
To understand the properties of the mean, let’s start with a toy example, i.e. a very small dataset in which it is easy to see what is going on.
Let’s say these are the heights (cm) and weights (kg) of 6 toddlers:
data = {'Name': ["Axel","Benji","Charlie","Danny","Edward","Freddie"],
        'Height': [89.0, 96.2, 93.4, 88.1, 91.7, 93.2],
        'Weight': [12.4, 13.8, 13.1, 12.9, 13.5, 14.0],}

toddlerData = pandas.DataFrame(data)
display(toddlerData)
| Name | Height | Weight | |
|---|---|---|---|
| 0 | Axel | 89.0 | 12.4 |
| 1 | Benji | 96.2 | 13.8 |
| 2 | Charlie | 93.4 | 13.1 |
| 3 | Danny | 88.1 | 12.9 |
| 4 | Edward | 91.7 | 13.5 |
| 5 | Freddie | 93.2 | 14.0 |
Eyeball the heights and have a guess what the mean height would be.
Somewhere in the low 90s…?
Let’s use the method mean from pandas to obtain the mean of the column Height
toddlerData['Height'].mean()
91.93333333333334
Shall we check we get the same if we impelement the formula ourselves (add up all the data points and divide by $n$)?
toddlerData['Height'].sum() # add up all the heights
551.6
toddlerData['Height'].count() # get n
6
# your code to divide the sum of heights by n
Hopefully you got the same answer as using the method mean
Median#
The median is the middle value of the dataset
To obtain the median:
- Sort the values to obtain a list $x_1, x_2, x_3 …. x_n$
- Count the values to obtain $n$
- If $n$ is odd, then the median is the middle value
- If $n$ is even, the median is halfway between the middle two values
Toy example: median#
Let’s get the median for our toddler height data using the method median from pandas
toddlerData['Height'].median()
92.45
And let’s check it matches the middle value in the sorted dataframe
display(toddlerData.sort_values(by='Height'))
| Name | Height | Weight | |
|---|---|---|---|
| 3 | Danny | 88.1 | 12.9 |
| 0 | Axel | 89.0 | 12.4 |
| 4 | Edward | 91.7 | 13.5 |
| 5 | Freddie | 93.2 | 14.0 |
| 2 | Charlie | 93.4 | 13.1 |
| 1 | Benji | 96.2 | 13.8 |
OK we need to get the halfway point between the middle two values:
(91.7+93.2)/2
92.45
Hurrah!
Effect of outliers#
What if someone made a data entry error?
data = {'Name': ["Axel","Benji","Charlie","Danny","Edward","Freddie"],
        'Height': [89.0, 962, 93.4, 88.1, 91.7, 93.2],
        'Weight': [12.4, 13.8, 13.1, 12.9, 13.5, 14.0]}

toddlerData_outlier = pandas.DataFrame(data)
display(toddlerData_outlier)
| Name | Height | Weight | |
|---|---|---|---|
| 0 | Axel | 89.0 | 12.4 |
| 1 | Benji | 962.0 | 13.8 |
| 2 | Charlie | 93.4 | 13.1 |
| 3 | Danny | 88.1 | 12.9 |
| 4 | Edward | 91.7 | 13.5 |
| 5 | Freddie | 93.2 | 14.0 |
- What error can you see in the dataframe above?
Let’s calculate the mean again:
toddlerData_outlier['Height'].mean()
236.23333333333335
Hm, that’s not a very plausible value for the average height of a toddler.
The mean is quite vulnerable to outliers, especially extreme outliers. This kind of outlier (where one data value is 10x larger than it should be) tends to arise from data entry errors.
What about the median?
toddlerData_outlier['Height'].median()
92.45
The median is completely unaffected by the outlier, as the middle two values stayed the same.
The median is sometimes said to be robust to outliers for this reason.
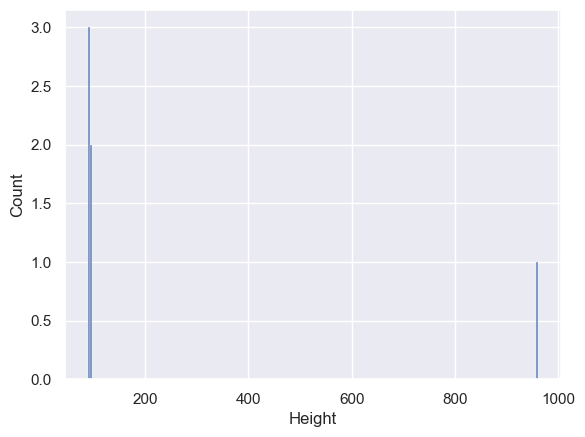
It is good practice to always plot your raw data, before you do anything else, so that you notice if there is an extreme outlier lurking in there.
Luckily with the computer, plotting the data takes little effort (don’t worry about the plotting code at the stage as there is a whole session on plotting later on).
# plot aa histogram of the heights - the outlier is obvious
sns.histplot(toddlerData_outlier['Height'])
<Axes: xlabel='Height', ylabel='Count'>