
14.3. Different types of multivariate relationship#
We have already discussed the spurious relationship, and how we might show that graphically with boxes and arrows. For example,
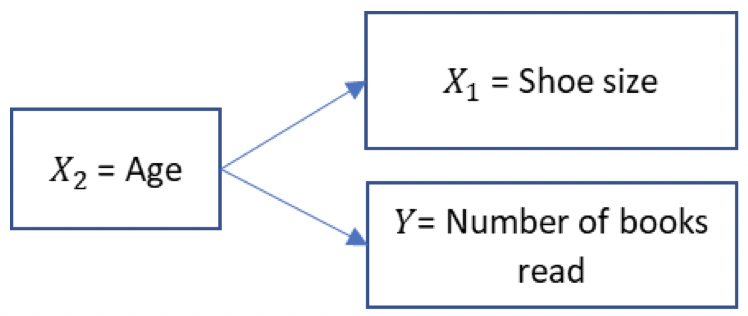
Multivariate relationships may also take the form of a chain relationship, where $x_1$ causes $x_2$ which causes $y$.
For example:

An interaction term is where the effect $x_1$ on $y$ is dependent on $x_2$. In this example, the size of the effect of socioeconomic status on health depends on age.
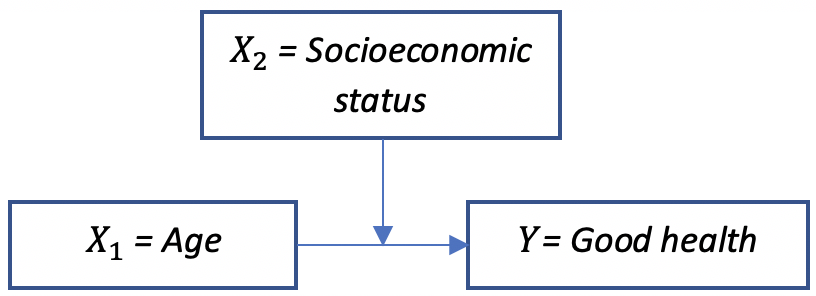
It is also helpful to graph interaction terms, for example:
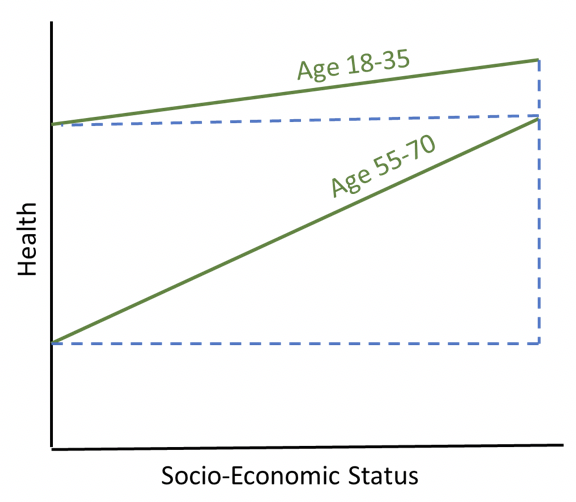
Here we can see that the slope for socioeconomic status is steeper for older people than for younger people. There is an interaction between socioeconomic status and age.
For other types of multivariate analysis, check back to the lecture slides on Canvas. (They include direct and indirect effects and multiple causes).