
2.9. Tutorial exercises I#
You should work through this is the tutorial. The idea is to bring together the skills you have learned (and highlight any gaps to discuss with your tutor)
Car park exercise#
In this exercise, you will plan car parking at a ferry terminal and inside the ferry itself.
You will be given data about the lengths of vehicles in a .csv file. By plotting the data and calculating descriptive statististics, you will produce a short report recommending the size and number of parking spots required.
The brief:
The SpeedyFerry Company are planning a new terminal. Vehicles will arrive at the terminal in advance of their sailing time and be parked in a car park to await boarding.
SpeedyFerry would like to know how to mark out the car park. They want to fit as many parking spaces into their land as possible, whilst still making sure that the vehicles fit in the spaces
- How long and wide should the parking spots be?
- Should different vehicle types be separated in different sections of the car park?
- If so, what ratio of long vehicle places to short vehicle places is needed?
Your task is to produce a report answering these questions, justifying you answer with plots and descriptive statistics based on the sample data provided by SpeedyFerry, introduced below

Set up Python libraries#
As usual, run the code cell below to import the relevant Python libraries
# Set-up Python libraries - you need to run this but you don't need to change it
import numpy as np
import matplotlib.pyplot as plt
import scipy.stats as stats
import pandas
import seaborn as sns
sns.set_theme()
Load and view the data#
To make our plan for car parking, we need some information about the vehicles to be accommodated.
SpeedyFerry have provided a data file with a complete list of the vehicles parked at a vehicle-ferry terminal at 1pm on Sunday 24th April 2022, which they regard as a representative sample.
Let’s load the datafile “data/vehicles.csv” and have a look what information we have in the dataset
vehicles = pandas.read_csv('https://raw.githubusercontent.com/jillxoreilly/StatsCourseBook/main/data/vehicles_2.csv')
display(vehicles)
| length | height | width | type | |
|---|---|---|---|---|
| 0 | 3.9187 | 1.5320 | 1.8030 | car |
| 1 | 4.6486 | 1.5936 | 1.6463 | car |
| 2 | 3.5785 | 1.5447 | 1.7140 | car |
| 3 | 3.5563 | 1.5549 | 1.7331 | car |
| 4 | 4.0321 | 1.5069 | 1.7320 | car |
| ... | ... | ... | ... | ... |
| 1359 | 15.5000 | 4.2065 | 2.5112 | truck |
| 1360 | 14.4960 | 4.1965 | 2.5166 | truck |
| 1361 | 9999.0000 | 4.1964 | 2.4757 | truck |
| 1362 | 14.3700 | 4.2009 | 2.5047 | truck |
| 1363 | 14.2350 | 4.2016 | 2.5212 | truck |
1364 rows × 4 columns
That was a long list of vehicles!
What information do we have about each vehicle?
Data cleaning#
Some implausible vehicle lengths are in the sample. They must be data entry errors.
Find them and replace them with NaNs.
# your code here to find the long vehicles

vehicles.sort_values(by='length', ascending=False)


# replace the incorrect vehicle lengths with NaNs
# vehicles.loc(.....)=np.nan
| length | height | width | type | |
|---|---|---|---|---|
| 1022 | 9999.0000 | 2.9010 | 2.2571 | towing |
| 1361 | 9999.0000 | 4.1964 | 2.4757 | truck |
| 1121 | 9999.0000 | 3.8834 | 2.4869 | truck |
| 1093 | 9999.0000 | 3.9173 | 2.5168 | truck |
| 1008 | 94.7230 | 2.8883 | 2.2566 | towing |
| ... | ... | ... | ... | ... |
| 6 | 3.2169 | 1.5708 | 1.7401 | car |
| 469 | 3.1957 | 1.5372 | 1.7438 | car |
| 811 | 3.1682 | 1.5888 | 1.7338 | car |
| 512 | 3.1197 | 1.4932 | 1.7817 | car |
| 653 | 3.1109 | 1.5512 | 1.7912 | car |
1364 rows × 4 columns
2.10. Your report for SpeedyFerry#
This is a stub for your report to SpeedyFerry.
The text in each markdown cell is given to guide you. You will replace this with your own text.
Similarly, you will edit the code in each code cell to produce the necessary plots and statistics.
This stub is quite structured to guide you through the process. Later in the course, you will develop your reports with less structured guidance.
# load the data
vehicles = ### your code here to load the csv file

# replace bad values with NaNs
  Cell In[4], line 2
    vehicles = ### your code here to load the csv file
               ^
SyntaxError: invalid syntax
Description of vehicle types and sizes#
Based on the sample data recorded at 1pm on Sunday 24th April 2022, the vehicles to be accommodated fall into XXX categories:
cars
xxx
xxx
The majority of vehicles are cars.
# your code to count vehicles by type -
# hint use groupby() and describe(), or use value_counts()
vehicles.groupby(['type']).describe()
| length | height | width | |||||||||||||||||||
|---|---|---|---|---|---|---|---|---|---|---|---|---|---|---|---|---|---|---|---|---|---|
| count | mean | std | min | 25% | 50% | 75% | max | count | mean | ... | 75% | max | count | mean | std | min | 25% | 50% | 75% | max | |
| type | |||||||||||||||||||||
| car | 981.0 | 4.269801 | 1.683456 | 3.1109 | 3.81810 | 4.1216 | 4.52020 | 45.438 | 981.0 | 1.580810 | ... | 1.6119 | 1.8993 | 981.0 | 1.791925 | 0.046921 | 1.6241 | 1.7602 | 1.79040 | 1.82090 | 1.9580 |
| towing | 53.0 | 198.786094 | 1372.101739 | 7.2561 | 8.13230 | 8.7012 | 9.23470 | 9999.000 | 53.0 | 2.897838 | ... | 2.9064 | 2.9445 | 53.0 | 2.248326 | 0.008222 | 2.2292 | 2.2442 | 2.24790 | 2.25400 | 2.2642 |
| truck | 330.0 | 104.695470 | 949.142610 | 11.1480 | 12.57725 | 14.4005 | 15.08325 | 9999.000 | 330.0 | 4.072725 | ... | 4.2009 | 4.2137 | 330.0 | 2.501304 | 0.015871 | 2.4629 | 2.4898 | 2.50145 | 2.51155 | 2.5467 |
3 rows × 24 columns
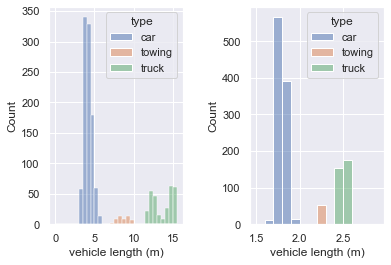
The length and width of vehicles differs substantially between classes
# produce a plot to illustrate the distribution of lengths and widths for each class
plt.subplot(1,2,1)
sns.histplot(data=vehicles, x="length", bins = np.arange(0,16,0.5), hue="type")
plt.xlabel('vehicle length (m)')

plt.subplot(1,2,2)
sns.histplot(data=vehicles, x="width", bins = np.arange(1.5,3,0.1), hue="type")
plt.xlabel('vehicle width (m)')

plt.subplots_adjust(wspace = 0.5) # shift the plots sideways so they don't overlap
The mean length of cars is 4.20m (sd 0.51), the mean length of trucks < your text here > and tows < your text here >.
# Your code here to output the mean and s.d. of length for each class
The mean width of cars is < your text here giving descriptives for width of each class >
# Your code here to output the mean and s.d. of width for each class
therefore we would recommend …..[your comment on how to segregate the parking areas for vehicle classes]……:
Size and number of parking spaces in each zone#
We recommend that the parking spaces in each zone should be sized to fit the 95th centile in length and width of each vehicle class.
The exact lengths are: /
# edit this code to give the 95th percentile (0.95 quantile) of measurements for each vehicle type
#

vehicles.groupby(['type']).q# complete the line!......
| length | height | width | |
|---|---|---|---|
| type | |||
| car | 4.61130 | 1.62480 | 1.83000 |
| towing | 9.27982 | 2.91196 | 2.25472 |
| truck | 15.21260 | 4.20212 | 2.51552 |
Given the observed frequencies in each vehicle class, we recommend the following minimum number of spaces in each zone, which is our observed vehicle counts +10% /< your text here - />
# your code to give the number of vehicles in each class -
# hint - similar to the code above but use .count() instead of .quantile()
| length | height | width | |
|---|---|---|---|
| type | |||
| car | 981 | 981 | 981 |
| towing | 53 | 53 | 53 |
| truck | 330 | 330 | 330 |