
1.4. Rolling a virtual dice I#

Set up Python libraries#
As usual, run the code cell below to import the relevant Python libraries
# Set-up Python libraries - you need to run this but you don't need to change it
import numpy as np
import matplotlib.pyplot as plt
import scipy.stats as stats
import pandas
import seaborn as sns
sns.set_theme()
Simulated dice roll#
We are going to get the computer to roll a ‘virtual’ dice. We call this a data simulation.
Data simulations are useful for getting a sense of how likely different outcomes are.
Of course, in the sense of a simple dice roll you can work out the probability of different outcomes using an equation, but many data generating processes (that is - systems that generate data) are sufficiently complex that a computer based simulation is necessary.
For example weather forecasts, predictions of disease spread and economic forecasts all use data simulations.
Let’s start simple…
Simulation of a single dice roll#
Of course, the computer does not really roll the dice.
It does something mathematically equivalent, that is generate a random integer (whole number) between 1 and 6.
np.random.randint(1,7)
5
What happened there?
We used numpy’s random number generator (numpy.random), which can generate all sorts of random numbers.
In this case we told it to give us an integer in the range [1,7)
The syntax here is a little surprising: randint(1,7) means “greater than or including 1” and “less than but NOT including 7”. In other words randint(1,7) returns 1,2,3,4,5 or 6 (but NOT 7)
This may seem a little unusual - you might have expected to see randint(1,6) instead.
In Python when we specify ranges they always include the lower bound but not the upper bound.
A real world example would be if a sign at a ticket booth said “junior ticket (children over 1 and under 7) £3” -
- a child on their first birthday needs the junior ticket
- a child of 6 years 364 days can buy the junior ticket
- a child on their 7th birthday cannot buy the junior ticket,
Try running the code block several times - you should get a different number on your 'dice' each time
Now we can ask numpy.random to give us lots of random integers (simulated dice rolls) as follows:
np.random.randint(1,7,10)
array([3, 3, 4, 4, 2, 1, 1, 5, 3, 4])
Now we got a numpy array with 10 random numbers in it.
- Can you work out how to change the code to get 12 "dice rolls"?
- Can you change the code to simulate rolling a 16-sided dice?

Simulation of rolling two dice#
In some games, players roll two dice and add the scores on both dice together.
Let’s simulate rolling two dice and adding the scores together:
d1 = np.random.randint(1,7)
d2 = np.random.randint(1,7)

dSum = d1+d2

print(dSum)
6
What happened there?
We simulated a dice roll by getting a random integer between 1 and 6 as before, but then we saved the outcome to a variable called d1 (short for “dice 1”) Then we did the same thin again and saved the result to a variable called d2 (short for “dice 2”)
Then we added d1 and d2 together
You may have come across the idea that with two dice, some scores are more frequent than others as there are more ways of making them from the scores on the individual dice. There is only one way of getting a 12, but six ways of getting a 7:

Let’s simulate rolling two dice lots of times using a for loop and plot the frequency of different overall scores:
dSum = np.empty(20)

for i in range(20):
    d1 = np.random.randint(1,7)
    d2 = np.random.randint(1,7)

    dSum[i] = d1+d2

# count up how many of each individual score there are
scores, counts = np.unique(dSum, return_counts=True)

print('scores on individual trials: ' + str(dSum))
print('possible scores: ' + str(scores))
print('frequency: ' + str(counts))
scores on individual trials: [ 7.  4. 11.  2.  9.  6.  8.  8.  9.  6.  5.  6.  5.  3.  9.  2.  6.  8.
  9.  8.]
possible scores: [ 2.  3.  4.  5.  6.  7.  8.  9. 11.]
frequency: [2 1 1 2 4 1 4 4 1]
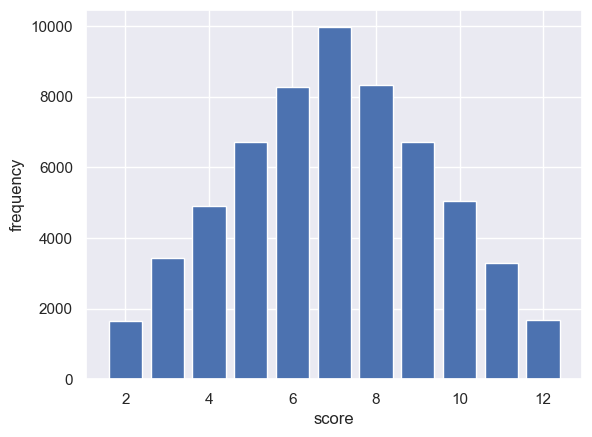
OK, now let’s simulate a really large number of trials and plot the frequency of getting each score on a bar plot
dSum = np.empty(60000)

for i in range(60000):
    d1 = np.random.randint(1,7)
    d2 = np.random.randint(1,7)

    dSum[i] = d1+d2

# count up how many of each individual score there are
scores, counts = np.unique(dSum, return_counts=True)

# plot them
plt.bar(scores, height=counts)
plt.xlabel('score')
plt.ylabel('frequency')
plt.show()
Exercise: rolling 3 or more dice#
Can you edit the code block to simulate the scores for 3 dice? What about 10 dice?
dSum = np.empty(60000)

for i in range(60000):
    d1 = np.random.randint(1,7)
    d2 = np.random.randint(1,7)
    d3 = .....

    dSum[i] = d1+d2+ ......

# count up how many of each individual score there are
scores, counts = np.unique(dSum, return_counts=True)

# plot them
plt.bar(scores, height=counts)
plt.xlabel('score')
plt.ylabel('frequency')
plt.show()
  Cell In[7], line 6
    d3 = .....
             ^
SyntaxError: invalid syntax