
16.9. Tutorial exercises#
The data this week were collected in 2019 for a project about the consequences of economic inequality (these data are real, from the same project as the data you used in Week 7 last term, but edited for this exercise).
The data were collected online and consisted of two parts, a short survey, and an online experiment.
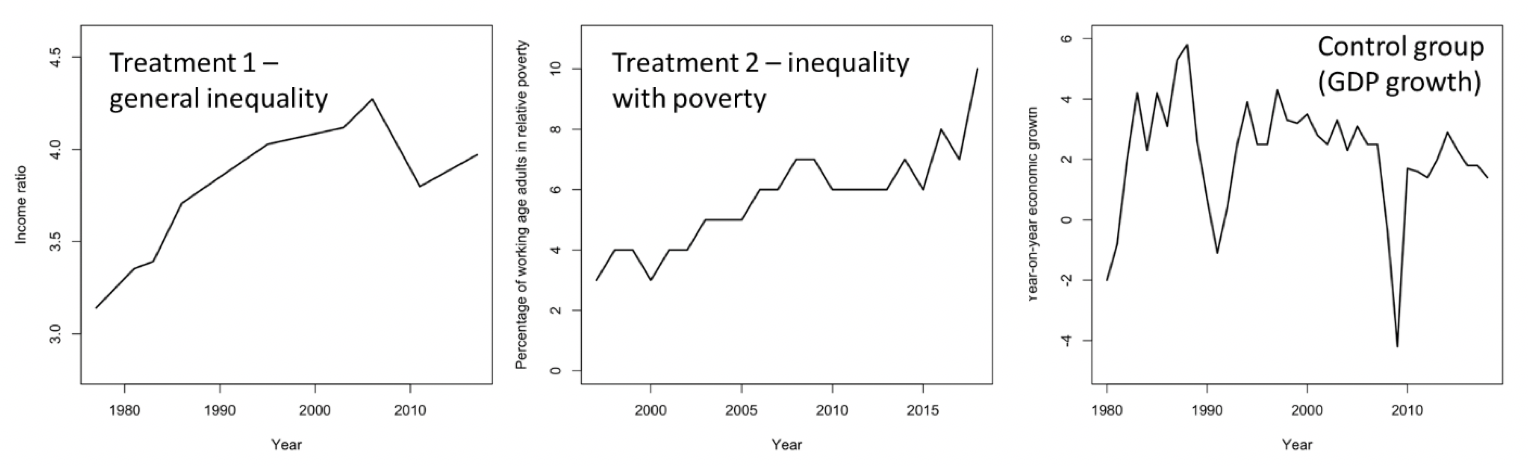
The online experiment divided the participants randomly into one of three groups with the following labels:
general inequality
inequality with poverty
the control group
The participants were shown a graph showing the general trend in inequality (group 1) and a graph about increasing numbers in poverty (group 2), or a graph about GDP (the control group).
These data were collected online by the polling company YouGov. The sample is intended to be representative of the UK adult population.
These were the ‘primes’ that were shown to the participants:
In this tutorial we will analyze the effect of the primes on people’s perception of their position in society
Set up Python libraries#
Copy an appropriate code cell below, and run it, to import the relevant Python libraries
# your code here
Import and view the data#
The data are available on Canvas as inequality.csv
Download the data and import them to Python as a pandas dataframe called data
# your code here
The dataframe contains the following variables:
ladder (a continuous measure of 1-11 where participants rate themselves in their standing in society, where the lowest rung on the ladder was labelled “bottom of society” and the top rung as “top of society”)
treatment (a categorical measure of the treatment/control group)
income (a categorical variable with four categories)
age (a continuous measure in years)
Get to know the data#
many values are in each experimental condition. Is this as expected?
One-way ANOVA#
The main research question for this exercise is this: does the treatment (the experimental condition on inequality) influence perceptions of social standing?
Answer this question with ANOVA. Before you start, write down the null and alternative hypotheses.
< state your hypotheses here >
# Your code here to run the ANOVA
What is the p-value and F-statistic? What does this tell us about the answer to the research question? Which hypothesis do you accept?
< your answer here >
Two-way ANOVA#
Next, run a two-way ANOVA including income as the control variable.
# Your code here to run the ANOVA
Interpret the results. Which of the $x$-variables are statistically significant?
< your interpretation here >
ANOVA vs Linear Regression#
Now, compare the results of the ANOVA tests with linear regressions.
Run two regression models; one with just treatment as the explanatory variable, and a second model that includes income as a control.
# your code here to run regression model 1
# you may need to refer back to last term's notes!
# your code here to run regression model 2
# you may need to refer back to last term's notes!
What information do we get from regression that we do not get from ANOVA?
< your answer here >
Check assumptions#
A member of the research team raised a concern that the outcome variable, ladder, does not seem to be normally distributed. Can you run a histogram, by experimental condition, to check this?
# your code here for the histogram
Do you think the normality assumption has been met?
< your comment here >
Kruskal-Wallis Test#
Either way, run a Krusal-Wallis test with the same variables (ladder, treatment) to check if you get the same result as with ANOVA.
# your code here
What is the result, and does it agree with the ANOVA?
< your comment here >
Including age as a control variable#
Age is a continuous variable. How could we use ANOVA to test whether there are differences in ‘ladder’ by age?
Create a new column in the dataframe called age4. Make it contain four categories for age:
under 30
30-45
45-65
over 65
Here is some code to get you started:
# create a new column and fill it with NaN for now
# data['age4'] = np.nan

# start filling in the values
# if this looks unfamiliar, check Sammi's cheatsheet (chapter 9 of this coursebook)
# data.loc[data['age'].isin(range(30, 46)), 'age4'] = "30 - 45"
Now run an ANOVA including age4 as a control variable
# your code here
Extra Exercise:#
Run two-way ANOVAs with interaction terms for:
treatment and age
income and age.
What are the questions you are trying to answer with the interaction terms? (Hint: “Is the effect of treatment the same for….”?)