15.4. Conditional Distributions#
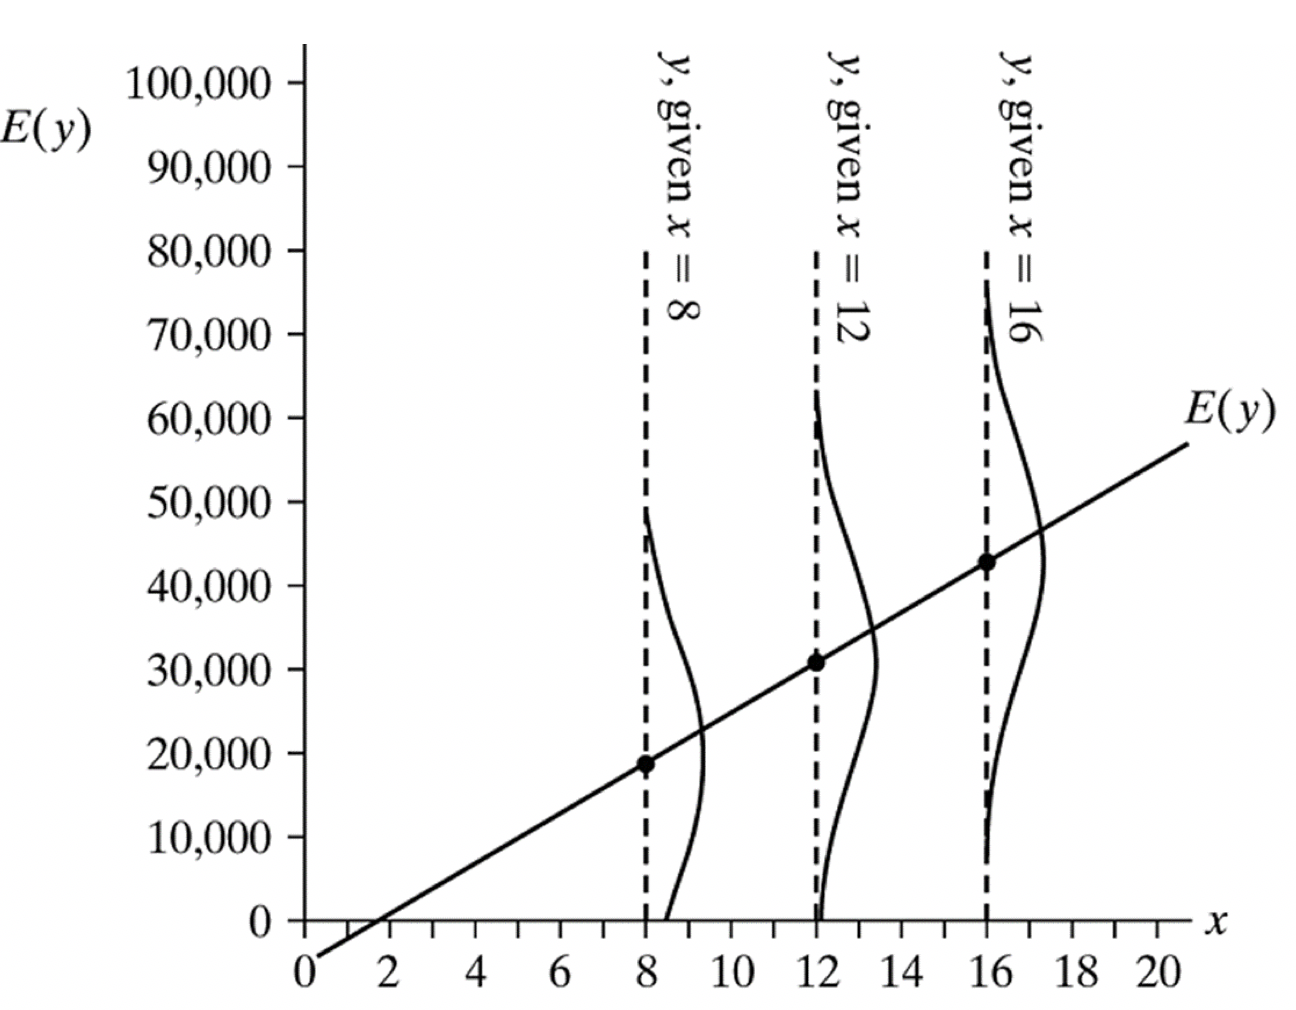
Conditional distributions refer to spread of value around the regression line.
In this example, where $y$ = income, and $x$ = years of education, the expected value of income = -5000 + 3000*years of education.
For people with 12 years of education ($𝑥$ = 12), the expected mean income is 31,000.
However, we can think of the predicted value as a predicted mean, and that there will be a normal distribution of values around that mean. The word ‘conditional’ here refers to the distribution of $y$, conditional on a given value of $x$.

We can use a statistic called the “Root mean square error” (Or RMSE) to estimate spread around the regression line.
The RMSE provides the estimated standard deviation of conditional distribution of $y$ at each value of $x$. It is also known as the standard deviation of the residuals.
The equation for the RMSE is:
$$ \sqrt{MSE} = s_y\sqrt{1-r^2} $$
Again, you’ll notice that it is comprised of familiar components, namely, the standard deviation of $y$, and $R^2$.
Coming back to the immigration data from last week, where $s_y$ = 2.533, and $r$ = -0.1572, plug these values into the equation and find the RMSE.
Click to reveal answer
$$RMSE = 2.533\sqrt{0.975288)} = 2.50$$
How do we interpret the RMSE?
Click to reveal answer
We expect 95% of the values of $y$ at a given $x$ to fall within 1.96 standard deviations of the mean.
note that if the sample size were smaller, we would not use 1.96, which is the critical value of $t$ for $\alpha=0.05$ and for large sample sizes (over about 50). Instead we would use the critical values of $t$ is for $\alpha$=0.05 and out actual sample size - there is a section on $t$ confidence intervals in the final lecture from Michaelmas Term.
Let’s look at an example when $x$ = 65. The regression line gives us a mean expected answer to the immigration question of 5.380 (based on the equation $\hat{y}=6.790-0.0217\times age$).
5.380 $\pm$ (1.96*2.50) = [0.480, 10.280]
When $x$ = 65, we expect 95% of values to fall between 0.480 and 10.280, which is a wide spread of values around the regression line.
