
1.4. Standard Deviation and IQR#
The standard deviation and inter quartile range (IQR) are measures of the spread of a distribution.
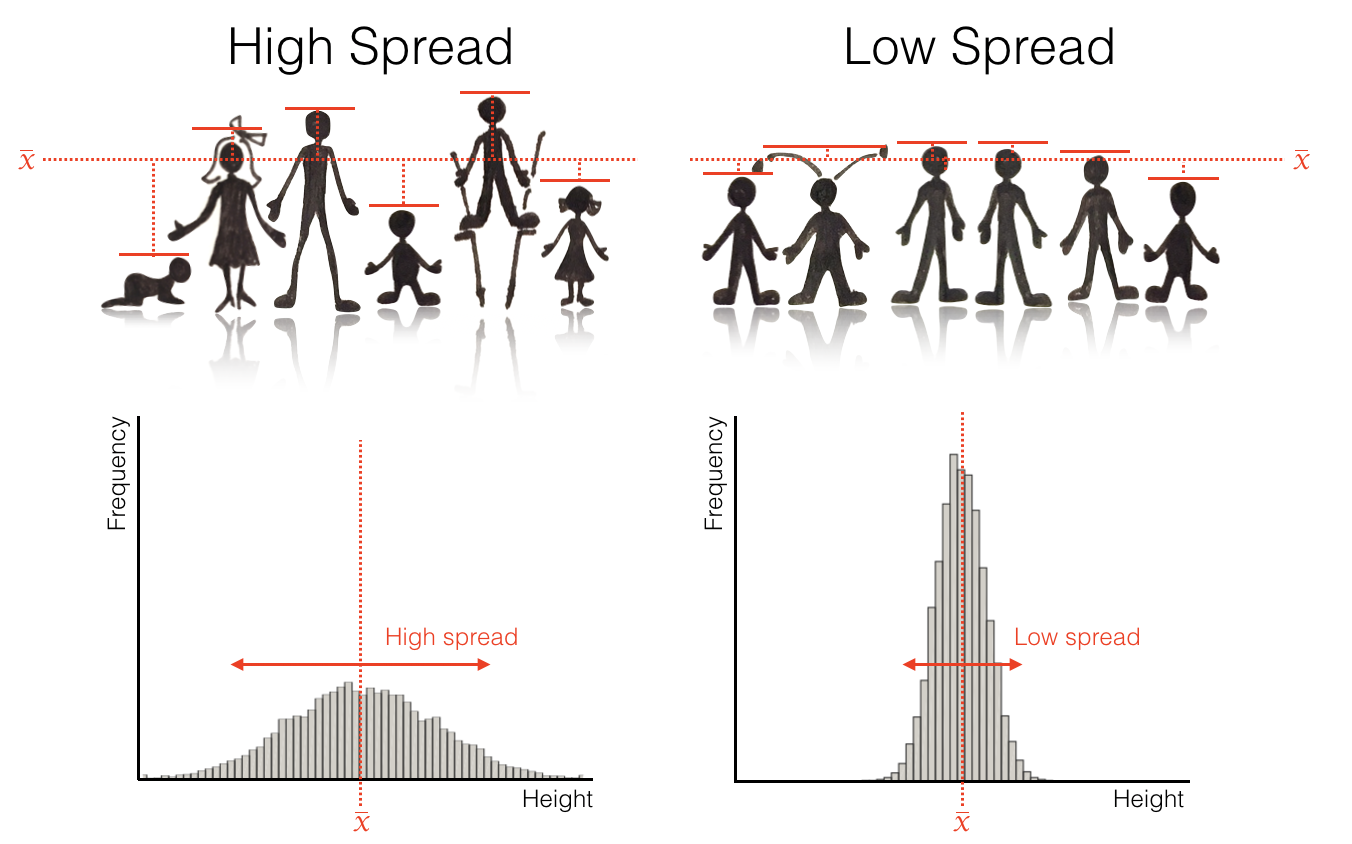
In a distribution with high spread, the datapoints are relatvely far from the mean (top image), resulting in a wide histogram (bottom image).
Standard deviaiton and IQR both tell you something about the typical or average value in your dataset - but different things.
Here is a video summarizing the conceptual differences between these measures.
1.4.1. The Standard Deviation#
The standard deviation is obtained as follows:
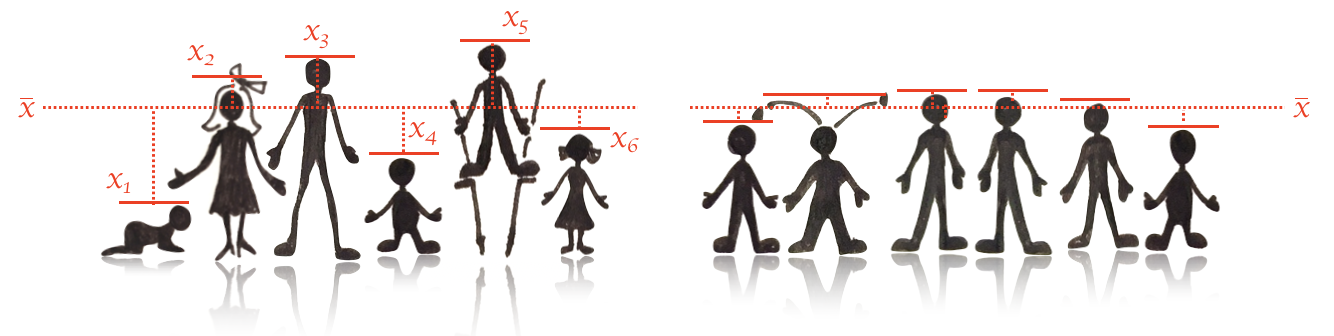
Find the difference between each datapoint and the mean value \((x_1 - \bar{x}), (x_2 - \bar{x})... (x_n - \bar{x}) \)
Square each difference
Add them all up
Divide by (\(n-1\)) where \(n\) is the number of datapoints
Take the square root of the whole thing
The process can be described by the formula
Where \(s_x\) is the standard deviation of the values \(x\).
One way to think about the standard deviation is that it is something like the average distance of data points from the mean (it is not quite that, because we get the average squared distance from each data point to the mean and then take its square root).
Squaring the values has two consequences
avoids positive and negative deviations cancelling out - positive deviations (values above the mean) and negative deviations (values below the mean) all become positive squared deviations As seen in the figure above, the deviations of the data points \(x_1, x_2... x_n\) from the mean \(\bar{x}\) are greater for a group with large spread (left) than small spread (right)
Applications#
We will learn more about the particular uses of the standard deviation throughout the course. Here is a a quick preview - if some of the terms are unfamiliar please just ignore at this stage - hopefully it will make sense when you come back for revision!
The standard deviation is particularly useful when working with variables with a known distribution, especially the Normal distribution
The standard deviation, in combination with the sample size \(n\), gives the standard error, which tells us how accurately our sample mean predicts a population mean
1.4.2. Inter Quartile Range (IQR)#
The inter quartile range or IQR is the difference between the 25th and 75th centile of a distribution - this difference is naturally larger in distributions with greater spread.
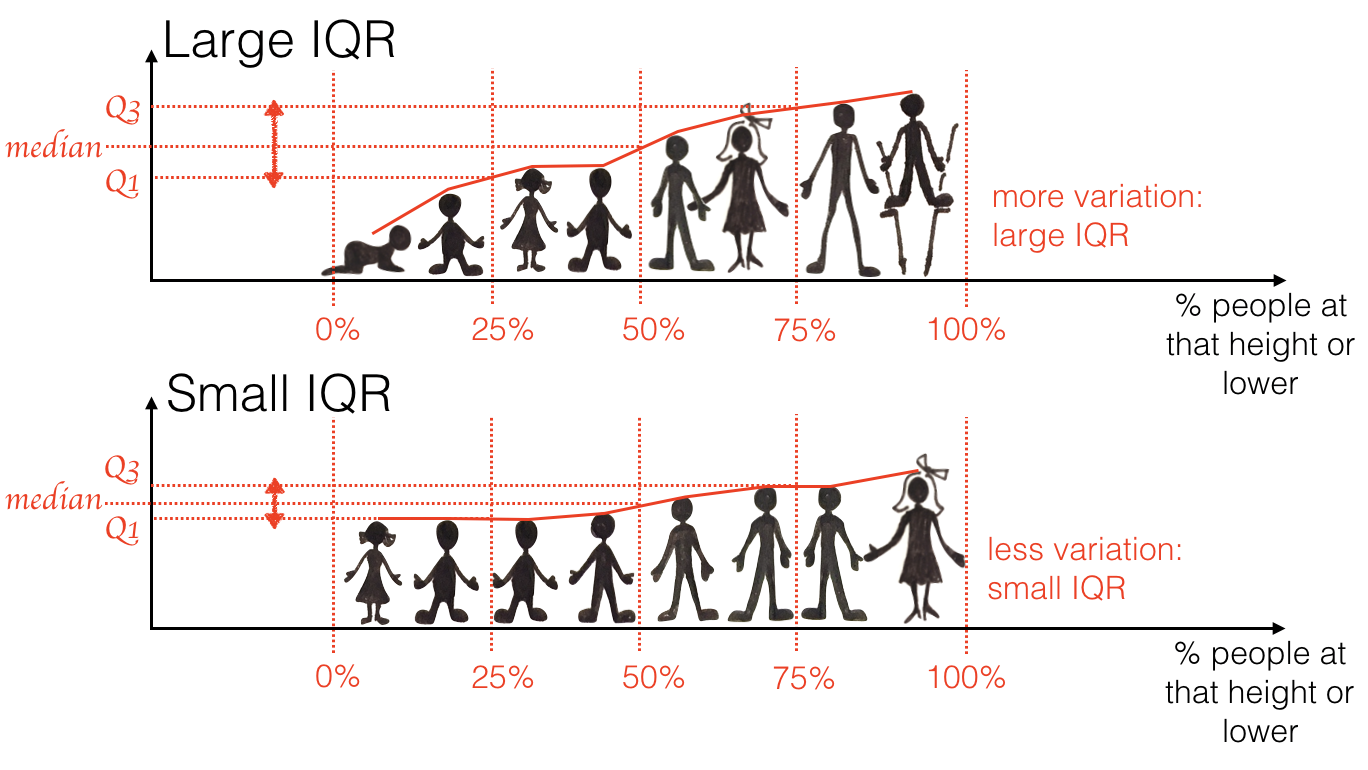
The 25th and 75th centile are the boundaries that contain the middle half of the data - for example, 25% of UK households had an income below £22,000, and 25% had an income over £44,000. The IQR is the difference between these values (£22,000) - although often it is more informative to actually give the 25th and 75th centiles.
The IQR as a measure of spread is naturally robust to outliers, because outliers are found at the ends of a distribution, not in the middle …
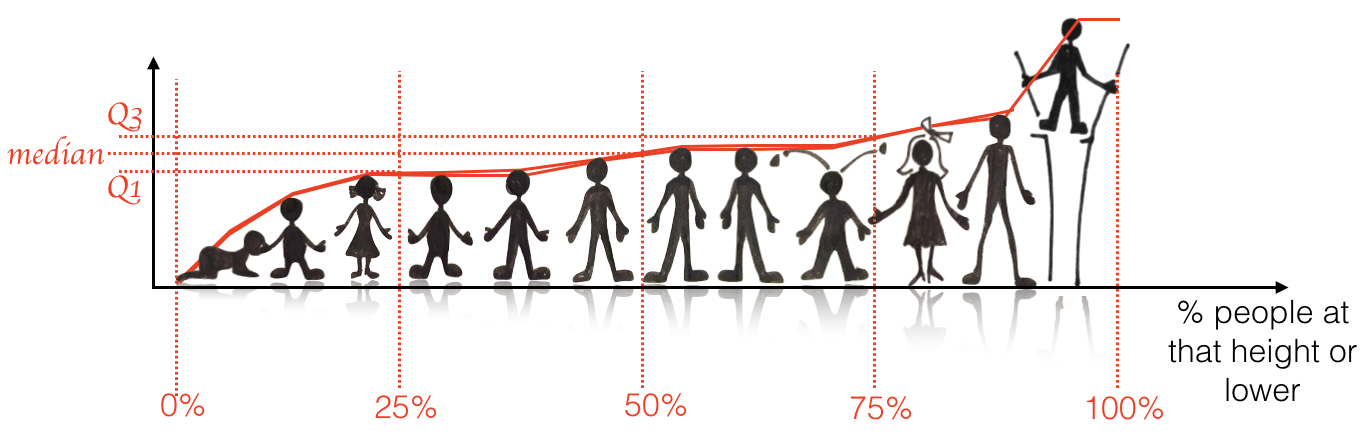
… therefore adding an outlier (in this case a very tall person) makes absolutely no difference to the value of the 75th centile and hence, no difference to IQR.