
3.11. Tutorial Exercises#
These tutorial exercises are designed to help you prepare for the first assignment.
As a researcher, there are two distinct phases to data analysis:
Understanding the dataset yourself - this involves making lots of quick plots and descriptive statistics to
check for outliers
find out the data distributions
look for differences between categories
look for associations between variables
Preparing a report for a reader - this involves a focus on readability and the reader
explain any key features of the dataset
highlighting key results with descriptive statistics and figures
figures should be well labelled and tweaked to make your point as clearly as possible
there should be clear, readable explanatory text
for most readers/clients, non technical language should be used
in all cases, jargon should be avoided
In these tutorial exercises, you will complete some guided tasks (and some open-ended ones) to explore the dataset for yourself.
For the hand-in assignment, you will produce a report on the same dataset for a specified reader.
3.11.1. Crime Survey Data#
We will work with a dataset extracted from the Crime Survey England and Wales 2013.
I obtained the data from the UK Data Service, a data repository run by the UK Research Councils. This text is from their introduction to the dataset:
The Crime Survey for England and Wales (CSEW) is a face-to-face victimisation survey in which people resident in households in England and Wales are asked about their experiences of a range of crimes in the 12 months prior to the interview. Respondents to the survey are also asked about their perceptions of crime and attitudes towards crime related issues such as the police and criminal justice system.
The dataset I have given you contains only some of the questions that respondants were asked, containing information about the respondants’ individual demographic features, neighbourhood, perceptions of crime and attitudes towards the police and criminal justice system.
The brief for the hand-in report will be to write a short report for the Home Secretary addressing two topics:
Which groups are the momst likely to be victims of crime? and
What factors affect confidence in policing and crimial justice?’,
Note that the idea is to write for a generic Home Secretary - they have responsibility for Law and Order and as a politician are interested in how different sections of the public perceive these issues. You can assume they have no statistical training. However there is no need to accommodate the political attitudes or personal characteristics of any particular Home Secretary.
In these preparatory exercises you will play around with the data to try and work out which factors are important predictors of that confidence.
I have put my own conclusions at the bottom of this page - this is just to give an idea of the kinds of things you might look at.
Note#
The survey was conducted in 2013 in the UK. Events of recent years may have affected the confidence of certain groups in the police; this would not be reflected in the data used here.
Set up Python libraries#
# Set-up Python libraries - you need to run this but you don't need to change it
import numpy as np
import matplotlib.pyplot as plt
import scipy.stats as stats
import pandas as pd
import seaborn as sns
sns.set_theme(style='white')
import statsmodels.api as sm
import statsmodels.formula.api as smf
Import the data#
Download the dataset from Canvas and import them as a dataframe called crime
crime = pd.read_csv('../data/CrimeData.csv')
crime
| ID | Sex | Age | AgeGroup | EthnicGroup | Education | SES | DeprivationIndex | Victim | effectx | fairx | confx | antisocx | |
|---|---|---|---|---|---|---|---|---|---|---|---|---|---|
| 0 | 135230170.0 | Male | 45.0 | 4 | White | University | 2.0 | 3.0 | 0.0 | NaN | NaN | 2.290506 | 3.42 |
| 1 | 135230210.0 | Male | 28.0 | 2 | White | University | 1.0 | 4.0 | 0.0 | -0.755949 | NaN | -0.349198 | -0.52 |
| 2 | 135231010.0 | Female | 58.0 | 5 | Black or Black British | NaN | 5.0 | 2.0 | 0.0 | -1.344910 | -0.544786 | 0.381797 | 2.27 |
| 3 | 135231210.0 | Male | 70.0 | 6 | Asian or Asian British | GCSE | 3.0 | 4.0 | 0.0 | NaN | NaN | NaN | NaN |
| 4 | 135233210.0 | Female | 64.0 | 5 | White | Other | 5.0 | 5.0 | 0.0 | 0.152448 | 0.914933 | -0.613168 | 0.84 |
| ... | ... | ... | ... | ... | ... | ... | ... | ... | ... | ... | ... | ... | ... |
| 9295 | 147638210.0 | Male | 43.0 | 3 | White | University | 1.0 | NaN | 0.0 | -0.436513 | NaN | -1.029429 | 0.31 |
| 9296 | 147639090.0 | Male | 70.0 | 6 | White | NaN | 5.0 | NaN | 0.0 | 0.132483 | NaN | 1.051876 | -0.45 |
| 9297 | 147639130.0 | Female | 80.0 | 7 | White | NaN | 5.0 | NaN | 0.0 | NaN | NaN | 0.808211 | 0.27 |
| 9298 | 147639250.0 | Male | 86.0 | 7 | White | University | 1.0 | NaN | 0.0 | -0.446495 | 0.408086 | 1.711802 | -0.56 |
| 9299 | 147639290.0 | Male | 70.0 | 6 | White | NaN | 2.0 | NaN | 0.0 | 1.579928 | NaN | -0.115685 | -1.22 |
9300 rows × 13 columns
Variables in the dataset#
Information about the respondant and their neighbourhood:
ID a unique number for each participant
Sex
Age in years
Age Group ages in 10-year groups
Ethnic Group the categories given are the ones recorded in the original survey
Education highest level of education completed; modern British qualifications are used as a short hand for any equivalent, for example ‘A-Levels’ includes any equivalent of completing high school to age 18.
SES socio-economic status
Managerial and professional occs
Intermediate occs
Small employers and own account workers
Lower supervisory and technical occupations
Semi-routine and routine occupations
Never worked and long term unemployed
Full-time students
Not classified
Deprivation Index this is a neighbourhood-level measure of poverty, in qunitiles
1 is the most deprived (poorest) 20% of neighbourhoods
5 is the least deprived (wealthiest) 20%
Victim has the respondant been a victim of crime in the last 12 months?
Information about the respondant’s attitudes on the following questions (each variable actually reflects a combination of the respondant’s answers to several questions; for example antisocx is based on several questions asking about different antisocial behaviours- ‘is there vandalism in your neighbourhood’, ‘are there gangs present in your neighbourhood’ etc):
effectx how effective is the criminal justice system?
fairx how fair is the criminal justice system?
confx how confident are you in the policing of your neighbourhood?
antisocx how much antisocial behaviour is there in your neighbourhood?
3.11.2. Getting to know the variables#
In this first section you will explore each variable individually by making suitable graphs. Complete each code block to produce a suitable plot or descriptive statistic. There are no right answers but in each case you should look at what you produced and evaluate whether your learned something from it!
# Are there more men or women in the sample?
# What ages were included in the survey and what is the distribution of respondants' ages?
# What are the bins used for the variable AgeGroup?
# How many respondants came from each ethnic group?
# What proportion of respondants have been a victim of crime in the last 12 months?
# For each of the attitude variables (effectx, fairx, confx and antisocx) plot the distribution
# For the attitude variables (effectx, fairx, confx and antisocx) what is the mean and standard deviation?
# Can you guess how these attitude variables ended up with that mean and standard deviation (think back to the section on standardizing data)?
# Which variables have a lot of missing data?
# HINT use df.isna() and sum()
3.11.3. Who is most likely to be a victim of crime?#
Explore which demographic variables make a different to the chance of being a victim of crime. Are more men than women victims of crime? etc
HINT as Victim is coded as 1 (if they have been a victim of crime in the past 12 months) and 0 (otherwise), you can obtain the proportion of people who have been a victim by taking the mean value of the column Victim.
You can also use sns.barplot() with the x and hue arguments to plot the proportion who are victims of crime within each category (each age group, etc).
You can also try disaggregating by a second variable, eg does whether men or women are more likely to be victims of crime differ by ethnic group?
# You will add several code blocks here to explore the data
3.11.4. Do attitudes differ depending on demographics?#
Looking at the attitude variables (effectx, fairx, confx and antisocx), which demographic factors seem to influence these?
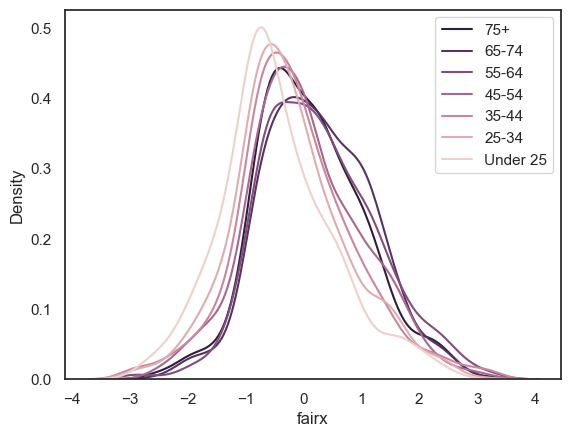
I found it most helpful to make KDE plots for the distribution of each attitude variable in each demographic group; because there are often many groups to compare, the simplicity of the KDE plot (without shading) is helpful.
Because there are different numbers of people in each group, you may want to normalize all the KDE plots to have the same area using the argument common_norm=False as below - this makes it easier to compare groups
sns.kdeplot(data=crime, x='fairx', hue='AgeGroup', common_norm=False)
plt.legend(labels = ['75+','65-74','55-64','45-54','35-44','25-34','Under 25'])
plt.show()
3.11.5. Do attitudes differ depending on whether the respondant has been a victim of crime?#
You can use a similar approach to that used for demographic factors above.
You imght think about disaggregating by some demographic factors - does being a victimm of crime make some groups more confident in the police (etc) and other groups, less confident? What might this say about different groups/ interactions with the police?
3.11.6. Conclusions#
Young people, students and those living in areas of high deprivation are more likely to be victims of crime and are more likely to experience antisocial behaviour in their neighbourhood.
Perhaps surprisingly, there is little diference in attitudes to the police and criminal justice system between these groups, and those groups who experience much less crime and antisocial behaviour; there is a slight effect that people of low SES or in areas of deprivation have momre positive, rather than neutral, attitudes to the police. There is quite a strong effect that young people have more negative attitudes to the criminal justice system than older people.
Those who have been a victim of crime have slightly higher average confidence in the police than those who have not; mainly, a large proportion of people who have not been victims of crime expressed neutral attitudes to the police.