
2.2. Probability Diagrams#
When thinking about the probability of a combination of events, it can be helpful to use a probability diagram.
Here we review how probability is represented in probability trees, contingency tables and bar plots
We will consider a sequence of two coin tosses. To understand these diagrams you need to know that, for two events that are independent (one does not affect the other), the combined probability is obtained by mutiplying the probabilities together
2.2.1. Probability Tree#
The probability tree represents the branching probabilities of different sequences of events:
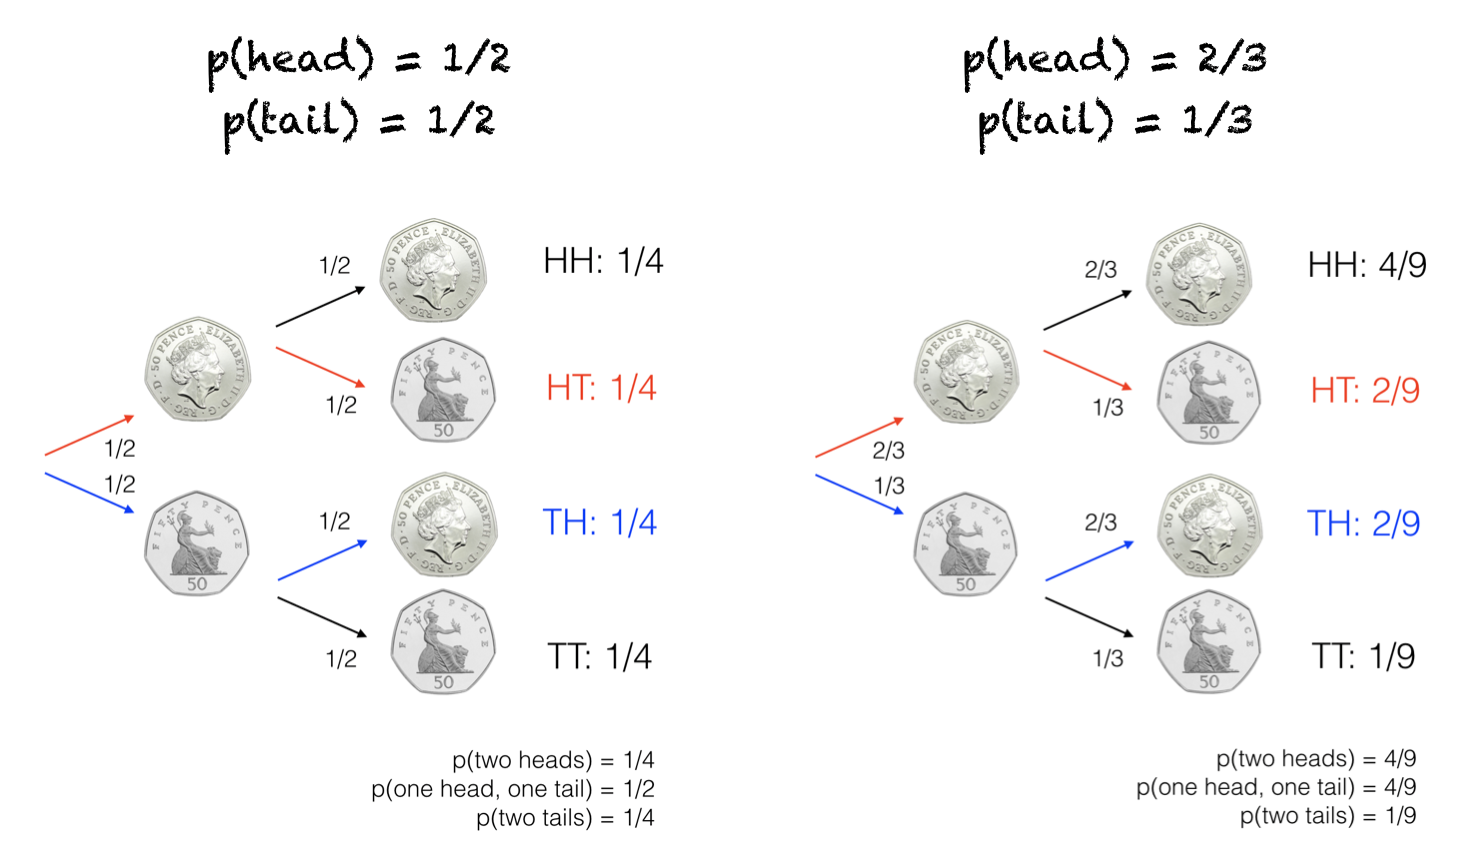
Thinking back to the Kolmogorov Axioms,
for a single coin toss, the set of elementary events is simply {H,T}
for the sequence of two coin tosses, the elementary events are the endpoints of the branches: {(H,H),(H,T),(T,H),(T,T)}
for the total number of heads, the elementary events are {2,1,0} as noted at the bottom right of the figure
2.2.2. Contingency tables#
A contingency table tells us the probability of each of the branch end-points (but doesn’t show the workings, as in the probability tree)
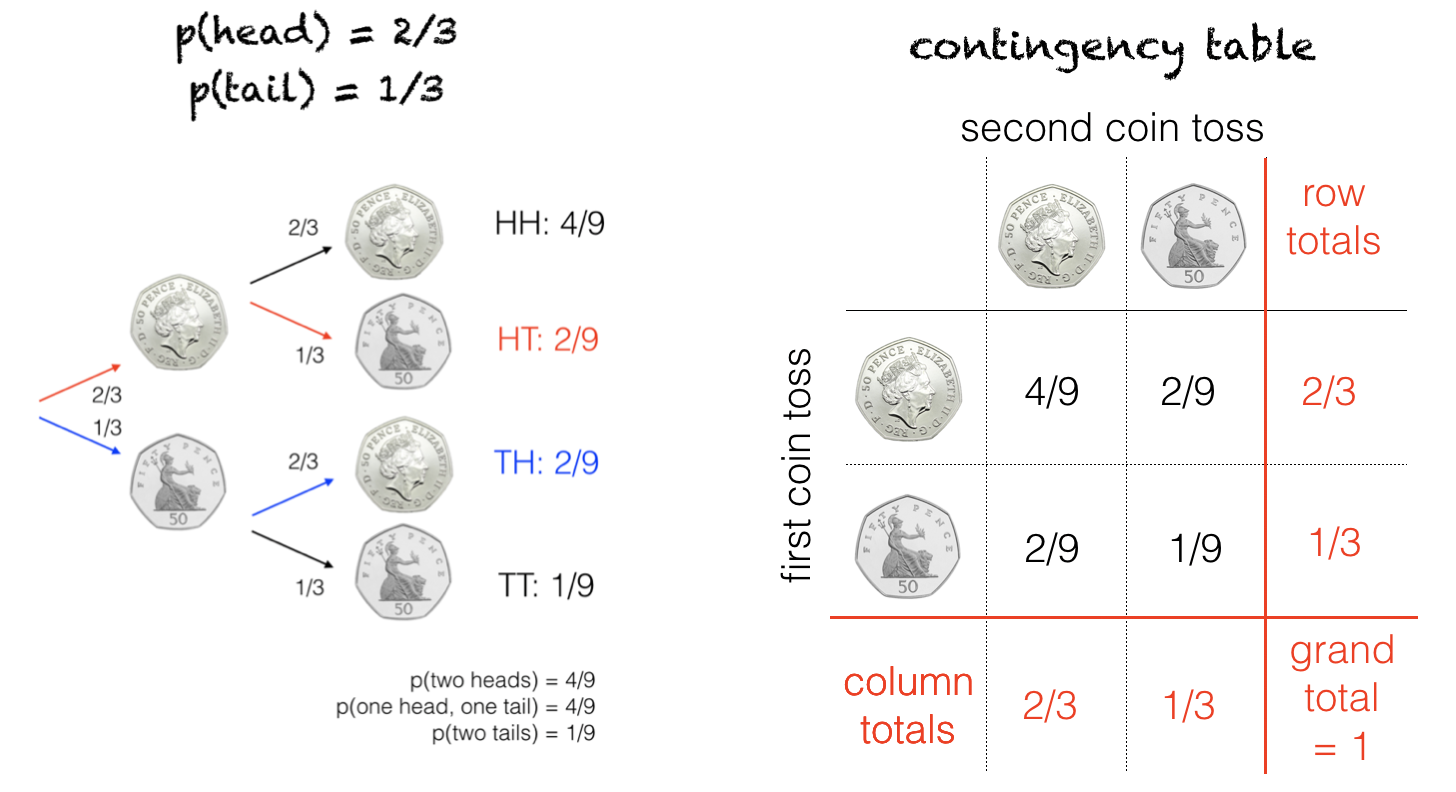
The red ‘totals’ summarize the probability of heads/tails on each individual coin toss; the grand total is the total probability within the table.
2.2.3. Bar plots#
Bar plots can be useful to visualize the relative probabilities of the branch end points.
For the coin tossing example we could summarize the frequency of each sequence, or each total number of heads, depending on which we are interested in.
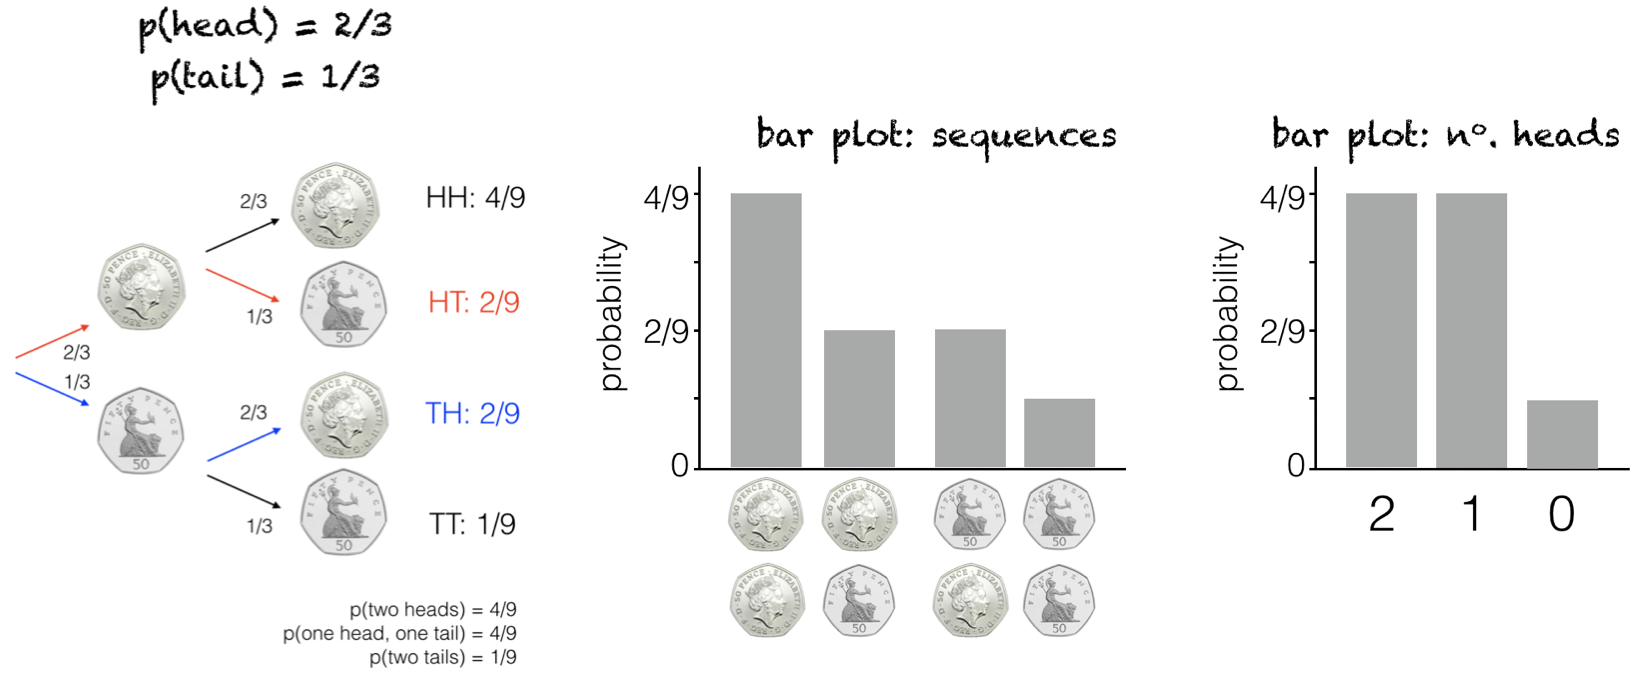
These probabilty bar plots can be thought of as diagrams or cartoons that ‘predict’ how a bar plot of actual data would look (if we were to toss a coin twice and repeat 10000 times, then plotted the frequency of each outcome in a bar plot).